Case Study - Performance Testing a Drupal Website

As Director of Technology, Alan plans and architects solutions to the complex problems Annertech solves on a daily basis.

Article content
At Annertech, there are three things we take very seriously: website/server security, accessibility, and website load times/performance. This article will look at website performance with metrics from recent work we completed for Oxfam Ireland.
We use a suite of tools for performance testing. Some of these include Apache Benchmark, Yahoo's YSlow, and Google's PageSpeed Insights. Our favourite at the moment is NewRelic, though this does come at a cost.
Apache Benchmark (AB) is used for testing of the server application as well as load testing. It can identify whether or not your caching has been set up correctly and indicate what pages might be under-performing due to complex database queries.
However, it doesn't render the page or execute the JavaScript so it is not helpful for front-end performance testing. As on average 90% of a web page's load time is accounted for by the front-end, this is where we focus most of our performance testing efforts.
Areas we pay attention to when performing front-end testing include:
- How long media assets take to load? This may indicate images in the content that are too large or too-high resolution. By reducing the file size of these images, we can improve the site load time.
- Design assets, such as icons, can also be combined together in a single 'sprite', again reducing the load time as the number of files also reduces the time spent waiting.
- Are there any scripts slowing down the site?
- Identify which ones take longest and see if they can be tweaked or made asychronous.
- Are there any CSS or JS files that can be compressed to make downloading and rendering quicker?
After we run our AB tests, we like to use services such as:
WebPageTest.org
SpeedCurve.com
Pingdom Tools
Chrome Developer Tools
Let's have a look at a case study of some of our recent work in this area.
Case Study: Improving the performance of oxfamireland.org
The Oxfam Ireland website was developed a number of years ago by Annertech, and while performance would have been important at the time, the reality is that a website can never be too fast. Oxfam asked us whether there were any marginal gains that were relatively quick to implement that we could deploy to the site.
Benchmark
If you can't measure it, your can't manage it. So the first step in improving performance is to see how the site currently stands.
There are lots of different ways to test the performance of a website, and for many years, the trusty Apache Benchmarking tool (AB) was our key weapon. This tool is still very useful in determining raw server performance for serving php pages.
However, in the case of Oxfam, we wanted something that was more relevant to real users. Enter "PageSpeed Insights".
PageSpeed Insights
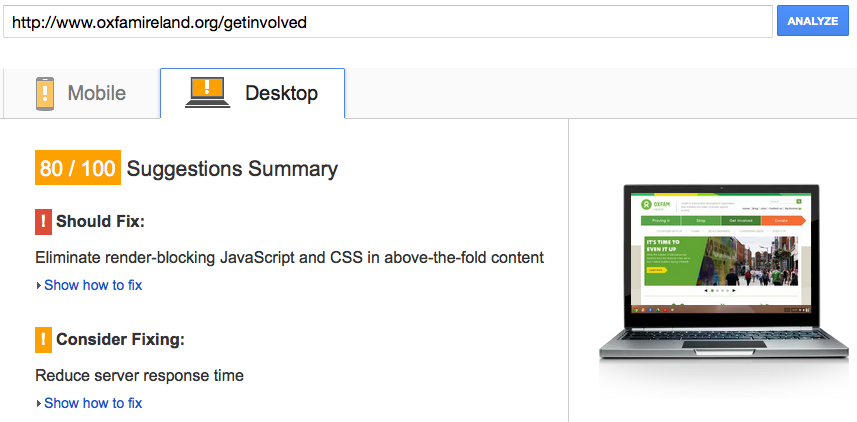
Our first tool deployed was Google's PageSpeed insights. This is a free service run by google, which downloads, parses and grades a website's performance.
The key difference over AB is that browser performance is tested – so all the assets required to render a page – HTML, images, CSS, JavaScript, fonts – are downloaded, including those on third party sites.
PageSpeed insights runs a series of tests against the site, checking for various best practices, and returns a headline figure result.
This can be a bit skewed, as the result can be gamed a little. The actual figure can be improved by adjusting some items than have no real impact for the actual site under test.
Still – its gives us a grade, that we can aim to improve on.
The grade returned two different values, one for mobile and one for desktop. We ran the test against two key pages on the site: the homepage, and the "Get Involved!" landing page.
WebPageTest
WebPageTest is another online testing tool, run by Patrick Meenan. While the UI might not be as nice as PageSpeed insights, the results returned are extremely detailed and very useful for in-depth performance monitoring and improvement.
In particular, the tests are run twice against the site, so any efforts made to leverage browser-side caching on subsequent page loads are measured.
For our purposes, we picked out 3 key metrics – SpeedIndex, Number of Requests and Page size. We aimed to reduce all of them. SpeedIndex is of particular interest. It is the average time at which visible parts of the page are displayed. From a user's perspective, this is a key value. There are other browser metrics that are measured, such as "DOM Content Loaded" and the "Onload" event, but SpeedIndex is really the best measure of "perceived performance" - as perceived by the end users.
What we did to improve things
Naturally a complete redesign/redevelopment was out of scope, and we're already using Drupal's inbuilt aggregation for CSS and JavaScript. The simplest tool at our disposal was the Advanced Aggregation module. However, this module isn't a straightforward 'set and forget' module, and takes some careful configuration and testing to produce the key results.
Our key objective was to move as much render-blocking JavaScript from the header of the HTML document to the footer. We also optimised the 'bundles' of CSS and javascript aggregated that are generated, and minified the javascript as part of the aggregation process.
How the numbers added up
After we had finalised our adjustments to the site, and verified the improvements on our staging infrastructure, the changes were deployed to the live site. As our focus was improving perceived speed, it was encouraging to see the significant improvement in the 'SpeedIndex' value.
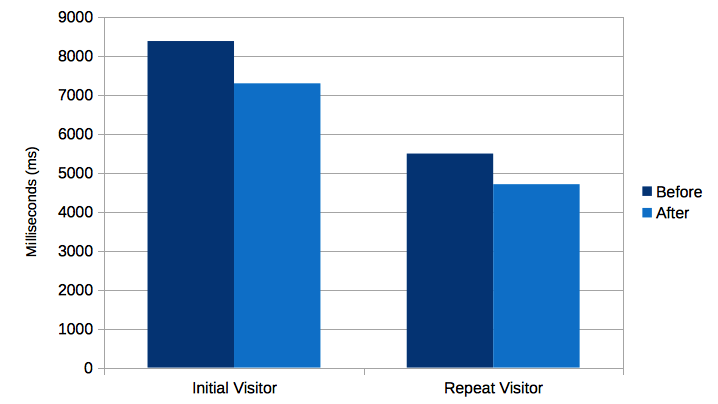
On the Homepage first view, the value moved from 8373 to 7268, an improvement of 12.98% and on the repeat view, the value moved from 5487 to 4702, an improvement of over 14%.
On the Get Involved page, we managed an improvement of over 10% on the first view, and almost 3% on the repeat view.
The other benchmarked values weren't improved significantly on this phase of the work, and indeed, the page weight increased slightly. This is a feature of performance improvement where significant increases in one benchmark may come at the cost of another.
The chart below shows the load time of Oxfam Ireland's home page before and after optimisation of the site. It shows the results for both initial visitors and repeat visitors, the latter being where their browser has cached some elements of the page.
Click here to read the full results of the process.
Ongoing
Since this work was carried out, a significant design update was applied to the homepage on the site. Using our predetermined benchmarking tools and measures, we were careful not to throw away our performance gains recently made.
The benchmarking process sets a line in the sand of where the website performance is currently at. Performance is now a key factor in any changes made to the website, and its has a significant effect on the bottom line.
As Director of Technology, Alan plans and architects solutions to the complex problems Annertech solves on a daily basis.
Related Blog Posts
-
 21 June 2024
Starshot to take Drupal to infinity and beyond
-
 7 March 2024
Annertech is a Drupal Certified Platinum Partner
-